---
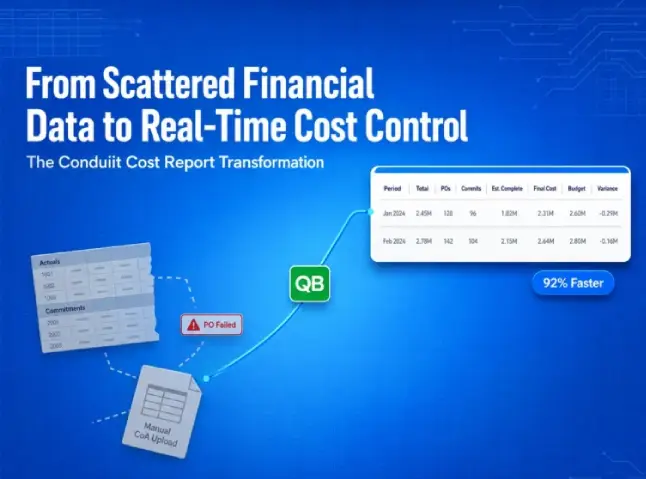
title: "From Scattered Financial Data to Real-Time Cost Control: The Conduiit Cost Report Transformation"
url: "https://satvasolutions.com/case-study/from-scattered-financial-data-to-real-time-cost-control-the-conduiit-cost-report-transformation-new"
date: "2026-07-27T14:06:06+05:30"
modified: "2026-08-05T15:53:30+05:30"
author:
  name: "vivek vadukiya"
word_count: 1049
reading_time: "6 min read"
summary: "Conduiit is a project and purchase order management platform built for production-driven businesses operating in the Film & Television finance ecosystem. The platform supports multi-project environ..."
description: "Conduiit is a project and purchase order management platform built for production-driven businesses operating in the Film &#038; Television finance ecosystem..."
language: "en"
schema_type: "WebPage"
---

# From Scattered Financial Data to Real-Time Cost Control: The Conduiit Cost Report Transformation

_Published: July 27, 2026_  
_Author: vivek vadukiya_  
![QuickBooks case study showing real-time cost control by transforming scattered financial data into automated reporting](https://satvasolutions.com/wp-content/uploads/2026/07/quickbooks-real-time-cost-control-case-study.webp)

<svg fill="none" height="26" stroke="white" stroke-width="2" viewbox="0 0 24 24" width="26"><circle cx="12" cy="12" r="9"></circle><circle cx="12" cy="12" r="4.5"></circle></svg>

## Snapshot

<svg fill="none" stroke="currentColor" stroke-linecap="round" stroke-linejoin="round" stroke-width="1.6" viewbox="0 0 24 24"><rect height="18" rx="1.5" width="16" x="4" y="3"></rect><path d="M10 21v-3h4v3"></path><path d="M8 7h.01M12 7h.01M16 7h.01"></path></svg>ClientConduiit<svg fill="none" stroke="currentColor" stroke-linecap="round" stroke-linejoin="round" stroke-width="1.6" viewbox="0 0 24 24"><path d="M4 7V5a2 2 0 012-2h12a2 2 0 012 2v2"></path><rect height="12" rx="2" width="20" x="2" y="7"></rect><path d="M10 7v12M14 7v12M7 11h10"></path></svg>IndustryFilm & Television Production Finance<svg fill="none" stroke="currentColor" stroke-linecap="round" stroke-linejoin="round" stroke-width="1.6" viewbox="0 0 24 24"><circle cx="12" cy="12" r="3"></circle><path d="M12 2v2M12 20v2M4.93 4.93l1.41 1.41M17.66 17.66l1.41 1.41M2 12h2M20 12h2M4.93 19.07l1.41-1.41M17.66 6.34l1.41-1.41"></path></svg>ServiceQuickBooks Integration & Cost Reporting Automation<svg fill="none" stroke="currentColor" stroke-linecap="round" stroke-linejoin="round" stroke-width="1.6" viewbox="0 0 24 24"><rect height="17" rx="2" width="18" x="3" y="4"></rect></svg>TimelineConfidential<svg fill="none" stroke="currentColor" stroke-linecap="round" stroke-linejoin="round" stroke-width="1.6" viewbox="0 0 24 24"><path d="M21 10c0 7-9 13-9 13s-9-6-9-13a9 9 0 0118 0z"></path><circle cx="12" cy="10" r="3"></circle></svg>RegionUSA<svg fill="none" stroke="currentColor" stroke-linecap="round" stroke-linejoin="round" stroke-width="1.6" viewbox="0 0 24 24"><path d="M17 21v-2a4 4 0 00-4-4H5a4 4 0 00-4 4v2"></path><circle cx="9" cy="7" r="4"></circle><path d="M23 21v-2a4 4 0 00-3-3.87"></path><path d="M16 3.13a4 4 0 010 7.75"></path></svg>TeamPM, Backend Dev, Frontend Dev, QA<svg fill="none" stroke="currentColor" stroke-linecap="round" stroke-linejoin="round" stroke-width="1.6" viewbox="0 0 24 24"><ellipse cx="12" cy="5" rx="8" ry="3"></ellipse><path d="M4 5v14c0 1.66 3.58 3 8 3s8-1.34 8-3V5"></path><path d="M4 12c0 1.66 3.58 3 8 3s8-1.34 8-3"></path></svg>TechnologyReact, .NET, QuickBooks Online API, SQL <svg fill="none" height="26" stroke="white" stroke-width="2" viewbox="0 0 24 24" width="26"><path d="M20 21v-2a4 4 0 00-4-4H8a4 4 0 00-4 4v2"></path><circle cx="12" cy="7" r="4"></circle></svg>

## Client Overview

Conduiit is a project and purchase order management platform built for production-driven businesses operating in the Film & Television finance ecosystem.

The platform supports multi-project environments where strict budget control, vendor coordination, and real-time financial oversight are critical to operational success.

As production volumes increased, the client needed to evolve Conduiit from a workflow management tool into a structured financial control system that could:

- Extend QuickBooks Budget vs Actual reporting
- Incorporate purchase order commitments (future obligations)
- Enable project-level budget configuration
- Support dynamic forecasting adjustments
- Preserve account hierarchy visibility
- Integrate seamlessly with QuickBooks Online

**The objective was clear:**

Deliver real-time, project-level cost intelligence without spreadsheet dependency or accounting friction.

 <svg fill="none" height="26" stroke="white" stroke-linecap="round" stroke-linejoin="round" stroke-width="2" viewbox="0 0 24 24" width="26"><path d="M10.29 3.86L1.82 18a2 2 0 001.71 3h16.94a2 2 0 001.71-3L13.71 3.86a2 2 0 00-3.42 0z"></path></svg>

## Problem

Conduiit needed a more reliable, real-time financial control system that could connect operational workflows with QuickBooks data.

1. <svg aria-hidden="true" class="cs-new-problem-warn" fill="none" stroke="currentColor" stroke-linecap="round" stroke-linejoin="round" stroke-width="1.5" viewbox="0 0 24 24"><path d="M10.29 3.86L1.82 18a2 2 0 001.71 3h16.94a2 2 0 001.71-3L13.71 3.86a2 2 0 00-3.42 0z"></path></svg>

### Incomplete Financial Visibility

    Actuals, commitments, budgets, and forecasts were scattered across systems and spreadsheets.

    2. <svg aria-hidden="true" class="cs-new-problem-warn" fill="none" stroke="currentColor" stroke-linecap="round" stroke-linejoin="round" stroke-width="1.5" viewbox="0 0 24 24"><path d="M10.29 3.86L1.82 18a2 2 0 001.71 3h16.94a2 2 0 001.71-3L13.71 3.86a2 2 0 00-3.42 0z"></path></svg>

### Limited Forecasting Control

    Users could not override projected final costs or adjust forecasts based on live project changes.

    3. <svg aria-hidden="true" class="cs-new-problem-warn" fill="none" stroke="currentColor" stroke-linecap="round" stroke-linejoin="round" stroke-width="1.5" viewbox="0 0 24 24"><path d="M10.29 3.86L1.82 18a2 2 0 001.71 3h16.94a2 2 0 001.71-3L13.71 3.86a2 2 0 00-3.42 0z"></path></svg>

### Lack of Project-Level Configuration

    No structured setup for project dates, budget allocation, and account visibility.

    4. <svg aria-hidden="true" class="cs-new-problem-warn" fill="none" stroke="currentColor" stroke-linecap="round" stroke-linejoin="round" stroke-width="1.5" viewbox="0 0 24 24"><path d="M10.29 3.86L1.82 18a2 2 0 001.71 3h16.94a2 2 0 001.71-3L13.71 3.86a2 2 0 00-3.42 0z"></path></svg>

### Fragile Purchase Order Workflow

    Purchase orders failed when vendors or expense accounts were missing in QuickBooks.

    5. <svg aria-hidden="true" class="cs-new-problem-warn" fill="none" stroke="currentColor" stroke-linecap="round" stroke-linejoin="round" stroke-width="1.5" viewbox="0 0 24 24"><path d="M10.29 3.86L1.82 18a2 2 0 001.71 3h16.94a2 2 0 001.71-3L13.71 3.86a2 2 0 00-3.42 0z"></path></svg>

### Manual Account Code Management

    Admins manually uploaded account codes, increasing mismatch risk and inconsistency.


 <svg fill="none" height="26" stroke="white" stroke-linecap="round" stroke-linejoin="round" stroke-width="2" viewbox="0 0 24 24" width="26"><circle cx="12" cy="12" r="10"></circle><polygon points="16.24 7.76 14.12 14.12 7.76 16.24 9.88 9.88 16.24 7.76"></polygon></svg>

## How We Approach

1. <svg fill="none" stroke="currentColor" stroke-linecap="round" stroke-linejoin="round" stroke-width="1.6" viewbox="0 0 24 24"><circle cx="11" cy="11" r="7"></circle></svg>Discover

    Studied financial workflow, QuickBooks dependency, reporting gaps, users, pain points.
2. <svg fill="none" stroke="currentColor" stroke-linecap="round" stroke-linejoin="round" stroke-width="1.8" viewbox="0 0 24 24"><polyline points="13 6 20 12 13 18"></polyline></svg>
3. <svg fill="none" stroke="currentColor" stroke-linecap="round" stroke-linejoin="round" stroke-width="1.6" viewbox="0 0 24 24"><path d="M9 5H7a2 2 0 00-2 2v12a2 2 0 002 2h10a2 2 0 002-2V7a2 2 0 00-2-2h-2"></path><rect height="4" rx="1" width="6" x="9" y="3"></rect></svg>Plan

    Designed data integration flow, mapping, permissions, automation strategy.
4. <svg fill="none" stroke="currentColor" stroke-linecap="round" stroke-linejoin="round" stroke-width="1.8" viewbox="0 0 24 24"><polyline points="13 6 20 12 13 18"></polyline></svg>
5. <svg fill="none" stroke="currentColor" stroke-linecap="round" stroke-linejoin="round" stroke-width="1.6" viewbox="0 0 24 24"><rect height="16" rx="2" width="18" x="3" y="4"></rect><polyline points="8 14 10 16 8 18"></polyline></svg>Execute

    Built modules, integrated QuickBooks API, automated workflows, performed rigorous testing.
6. <svg fill="none" stroke="currentColor" stroke-linecap="round" stroke-linejoin="round" stroke-width="1.8" viewbox="0 0 24 24"><polyline points="13 6 20 12 13 18"></polyline></svg>
7. <svg fill="none" stroke="currentColor" stroke-linecap="round" stroke-linejoin="round" stroke-width="1.6" viewbox="0 0 24 24"><path d="M4.5 16.5c-1.5 1.26-2 5-2 5s3.74-.5 5-2c.71-.84.7-2.13-.09-2.91a2.18 2.18 0 00-2.91-.09z"></path><path d="M12 15l-3-3a22 22 0 012-3.95A12.88 12.88 0 0122 2c0 2.72-.78 7.5-6 11a22.35 22.35 0 01-4 2z"></path></svg>Deliver

    Deployed solution, validated accuracy, trained users, provided support.

 <svg fill="none" height="26" stroke="white" stroke-linecap="round" stroke-linejoin="round" stroke-width="2" viewbox="0 0 24 24" width="26"><path d="M14 2H6a2 2 0 00-2 2v16a2 2 0 002 2h12a2 2 0 002-2V8z"></path><polyline points="14 2 14 8 20 8"></polyline></svg>

## The Solution

Satva Solutions designed and implemented an integrated Cost Reporting & Intelligent Purchase Order Automation module within Conduiit transforming it into a real-time financial control system.

1.

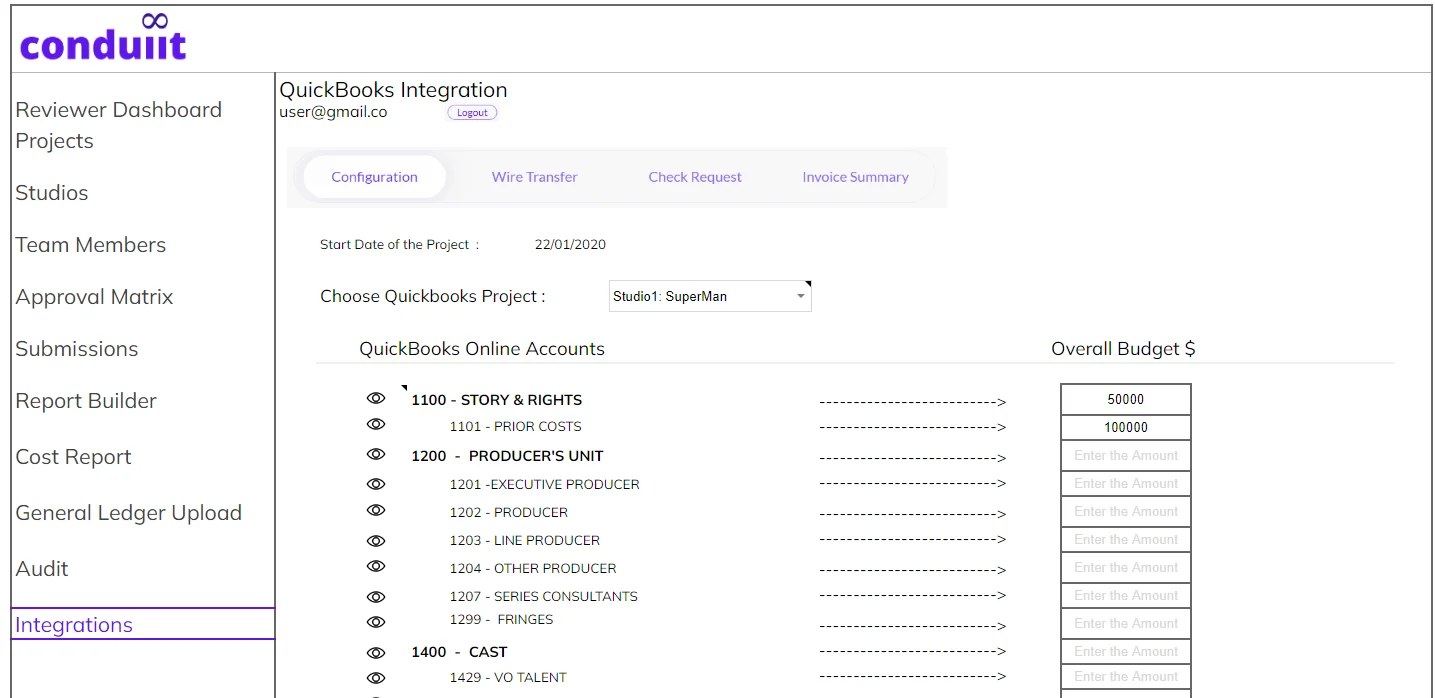
### Configuration-Driven Reporting Framework

    A structured setup process ensures accurate financial mapping before reports are generated.

    Users configure:


    - <svg fill="none" viewbox="0 0 12 12"><path d="M2 6l2.5 2.5L10 3" stroke="currentColor" stroke-linecap="round" stroke-linejoin="round" stroke-width="1.8"></path></svg>QuickBooks Online OAuth connection
    - <svg fill="none" viewbox="0 0 12 12"><path d="M2 6l2.5 2.5L10 3" stroke="currentColor" stroke-linecap="round" stroke-linejoin="round" stroke-width="1.8"></path></svg>Project selection and start date
    - <svg fill="none" viewbox="0 0 12 12"><path d="M2 6l2.5 2.5L10 3" stroke="currentColor" stroke-linecap="round" stroke-linejoin="round" stroke-width="1.8"></path></svg>Expense-type Chart of Accounts (auto-fetched)
    - <svg fill="none" viewbox="0 0 12 12"><path d="M2 6l2.5 2.5L10 3" stroke="currentColor" stroke-linecap="round" stroke-linejoin="round" stroke-width="1.8"></path></svg>Budget allocation per account
    - <svg fill="none" viewbox="0 0 12 12"><path d="M2 6l2.5 2.5L10 3" stroke="currentColor" stroke-linecap="round" stroke-linejoin="round" stroke-width="1.8"></path></svg>Show/Hide account visibility

    This guarantees clean alignment between operational data and accounting records.
     ![QuickBooks integration dashboard showing project account mapping, production budget allocation and financial configuration panel](https://satvasolutions.com/wp-content/uploads/2026/03/quickbooks-integration-dashboard-budget-m.webp)
     2.

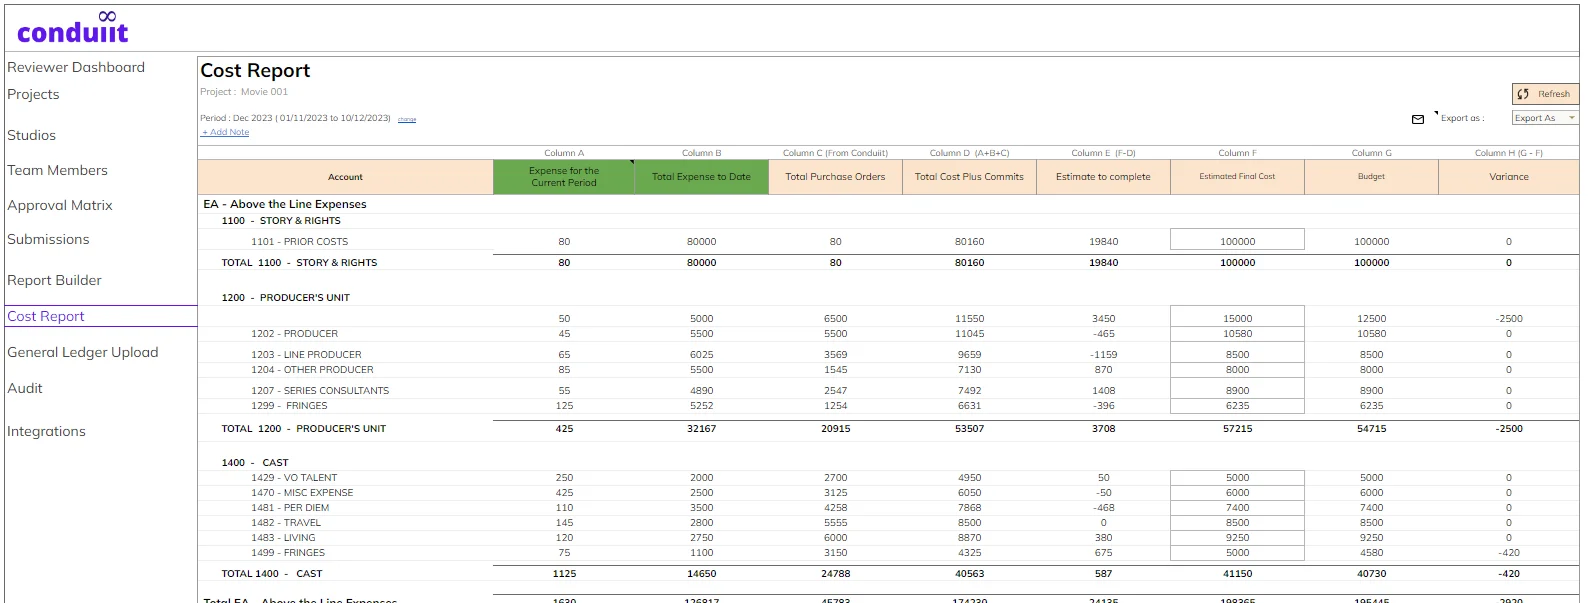
### Advanced 8-Column Cost Report

    A unified financial view combining:


    - <svg fill="none" viewbox="0 0 12 12"><path d="M2 6l2.5 2.5L10 3" stroke="currentColor" stroke-linecap="round" stroke-linejoin="round" stroke-width="1.8"></path></svg>Current Period Expenses
    - <svg fill="none" viewbox="0 0 12 12"><path d="M2 6l2.5 2.5L10 3" stroke="currentColor" stroke-linecap="round" stroke-linejoin="round" stroke-width="1.8"></path></svg>Total Expenses to Date
    - <svg fill="none" viewbox="0 0 12 12"><path d="M2 6l2.5 2.5L10 3" stroke="currentColor" stroke-linecap="round" stroke-linejoin="round" stroke-width="1.8"></path></svg>Approved Purchase Orders (Commitments)
    - <svg fill="none" viewbox="0 0 12 12"><path d="M2 6l2.5 2.5L10 3" stroke="currentColor" stroke-linecap="round" stroke-linejoin="round" stroke-width="1.8"></path></svg>Total Plus Commits
    - <svg fill="none" viewbox="0 0 12 12"><path d="M2 6l2.5 2.5L10 3" stroke="currentColor" stroke-linecap="round" stroke-linejoin="round" stroke-width="1.8"></path></svg>Estimate to Complete
    - <svg fill="none" viewbox="0 0 12 12"><path d="M2 6l2.5 2.5L10 3" stroke="currentColor" stroke-linecap="round" stroke-linejoin="round" stroke-width="1.8"></path></svg>Estimated Final Cost (Editable)
    - <svg fill="none" viewbox="0 0 12 12"><path d="M2 6l2.5 2.5L10 3" stroke="currentColor" stroke-linecap="round" stroke-linejoin="round" stroke-width="1.8"></path></svg>Budget
    - <svg fill="none" viewbox="0 0 12 12"><path d="M2 6l2.5 2.5L10 3" stroke="currentColor" stroke-linecap="round" stroke-linejoin="round" stroke-width="1.8"></path></svg>Variance

    Unlike standard reports, this model integrates:

    Actuals + Commitments + Forecast + Budget in one structured report.
     ![Production cost report dashboard showing budget, expenses, purchase orders, estimated cost and variance for project accounting](https://satvasolutions.com/wp-content/uploads/2026/03/production-cost-report-budget-vs-expense-.webp)
     3.

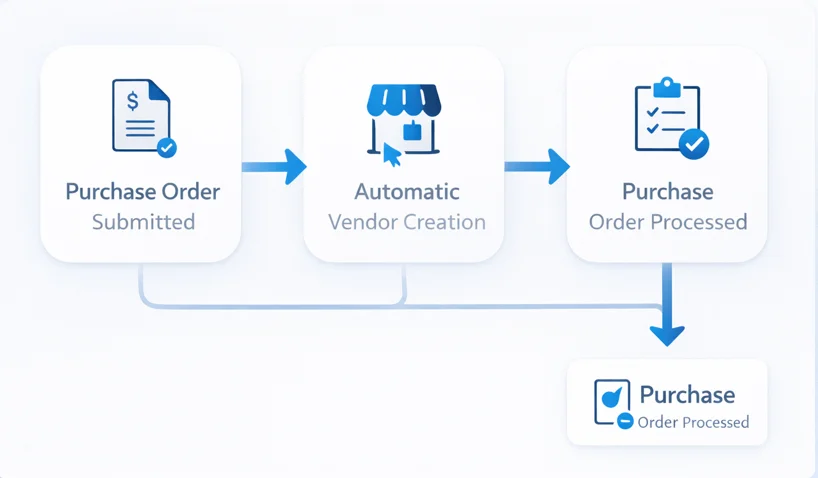
### Intelligent Purchase Order Automation

    The purchase order workflow was redesigned to eliminate failure scenarios.

    The system automatically:


    - <svg fill="none" viewbox="0 0 12 12"><path d="M2 6l2.5 2.5L10 3" stroke="currentColor" stroke-linecap="round" stroke-linejoin="round" stroke-width="1.8"></path></svg>Creates missing vendors
    - <svg fill="none" viewbox="0 0 12 12"><path d="M2 6l2.5 2.5L10 3" stroke="currentColor" stroke-linecap="round" stroke-linejoin="round" stroke-width="1.8"></path></svg>Creates required expense accounts
    - <svg fill="none" viewbox="0 0 12 12"><path d="M2 6l2.5 2.5L10 3" stroke="currentColor" stroke-linecap="round" stroke-linejoin="round" stroke-width="1.8"></path></svg>Handles both-missing scenarios
    - <svg fill="none" viewbox="0 0 12 12"><path d="M2 6l2.5 2.5L10 3" stroke="currentColor" stroke-linecap="round" stroke-linejoin="round" stroke-width="1.8"></path></svg>Instantly generates POs when records exist

    This ensures uninterrupted accounting workflows and data accuracy.
     ![Purchase order automation workflow showing submitted PO, automatic vendor creation and purchase order processing system](https://satvasolutions.com/wp-content/uploads/2026/03/purchase-order-automation-vendor-creation.webp)
     4.

### Direct Chart of Accounts Synchronization

        - <svg fill="none" viewbox="0 0 12 12"><path d="M2 6l2.5 2.5L10 3" stroke="currentColor" stroke-linecap="round" stroke-linejoin="round" stroke-width="1.8"></path></svg>Expense accounts pulled directly from QuickBooks
    - <svg fill="none" viewbox="0 0 12 12"><path d="M2 6l2.5 2.5L10 3" stroke="currentColor" stroke-linecap="round" stroke-linejoin="round" stroke-width="1.8"></path></svg>No manual uploads
    - <svg fill="none" viewbox="0 0 12 12"><path d="M2 6l2.5 2.5L10 3" stroke="currentColor" stroke-linecap="round" stroke-linejoin="round" stroke-width="1.8"></path></svg>Reload capability for live updates
    - <svg fill="none" viewbox="0 0 12 12"><path d="M2 6l2.5 2.5L10 3" stroke="currentColor" stroke-linecap="round" stroke-linejoin="round" stroke-width="1.8"></path></svg>Parent-child hierarchy preserved

    This eliminates mismatches and maintains financial consistency.

    5.

### Streamlined Reporting & Communication

    Users can:


    - <svg fill="none" viewbox="0 0 12 12"><path d="M2 6l2.5 2.5L10 3" stroke="currentColor" stroke-linecap="round" stroke-linejoin="round" stroke-width="1.8"></path></svg>Select flexible reporting periods (Month, Quarter, Year, Custom Month Range)
    - <svg fill="none" viewbox="0 0 12 12"><path d="M2 6l2.5 2.5L10 3" stroke="currentColor" stroke-linecap="round" stroke-linejoin="round" stroke-width="1.8"></path></svg>Add report-level notes
    - <svg fill="none" viewbox="0 0 12 12"><path d="M2 6l2.5 2.5L10 3" stroke="currentColor" stroke-linecap="round" stroke-linejoin="round" stroke-width="1.8"></path></svg>Export PDF & XLSX
    - <svg fill="none" viewbox="0 0 12 12"><path d="M2 6l2.5 2.5L10 3" stroke="currentColor" stroke-linecap="round" stroke-linejoin="round" stroke-width="1.8"></path></svg>Email reports (up to 10 recipients)
    - <svg fill="none" viewbox="0 0 12 12"><path d="M2 6l2.5 2.5L10 3" stroke="currentColor" stroke-linecap="round" stroke-linejoin="round" stroke-width="1.8"></path></svg>Refresh real-time data

    Reporting is standardized, accurate, and executive-ready.


<svg fill="none" height="26" stroke="white" stroke-width="2" viewbox="0 0 24 24" width="26"><rect height="7" width="7" x="3" y="3"></rect><rect height="7" width="7" x="14" y="3"></rect><rect height="7" width="7" x="14" y="14"></rect><rect height="7" width="7" x="3" y="14"></rect></svg>

## Workflow

1.  <svg aria-hidden="true" fill="currentColor" viewbox="0 0 24 24" xmlns="http://www.w3.org/2000/svg"> <path d="M16 11c1.66 0 3-1.34 3-3s-1.34-3-3-3-3 1.34-3 3 1.34 3 3 3zm-8 0c1.66 0 3-1.34 3-3S9.66 5 8 5 5 6.34 5 8s1.34 3 3 3zm0 2c-2.33 0-7 1.17-7 3.5V19h14v-2.5c0-2.33-4.67-3.5-7-3.5zm8 0c-.29 0-.62.02-.97.05 1.16.84 1.97 1.97 1.97 3.45V19h6v-2.5c0-2.33-4.67-3.5-7-3.5z"></path> </svg> User / Finance Team
2. <svg fill="none" stroke="currentColor" stroke-linecap="round" stroke-linejoin="round" stroke-width="2" viewbox="0 0 24 24"><polyline points="13 7 19 12 13 17"></polyline></svg>
3.  <svg aria-hidden="true" fill="none" viewbox="0 0 120 36" xmlns="http://www.w3.org/2000/svg"> <text fill="#0896d2" font-family="IBM Plex Sans, sans-serif" font-size="25" font-weight="700" text-anchor="middle" x="60" y="27">Conduiit</text> </svg> Conduiit Platform
4. <svg fill="none" stroke="currentColor" stroke-linecap="round" stroke-linejoin="round" stroke-width="2" viewbox="0 0 24 24"><polyline points="13 7 19 12 13 17"></polyline></svg>
5.  <svg aria-hidden="true" fill="none" stroke="currentColor" stroke-linecap="round" stroke-linejoin="round" stroke-width="1.8" viewbox="0 0 24 24" xmlns="http://www.w3.org/2000/svg"> <circle cx="12" cy="12" r="3"></circle> <path d="M19.4 15a1.65 1.65 0 00.33 1.82l.06.06a2 2 0 01-2.83 2.83l-.06-.06a1.65 1.65 0 00-1.82-.33 1.65 1.65 0 00-1 1.51V21a2 2 0 01-4 0v-.09A1.65 1.65 0 009 19.4a1.65 1.65 0 00-1.82.33l-.06.06a2 2 0 01-2.83-2.83l.06-.06A1.65 1.65 0 004.68 15a1.65 1.65 0 00-1.51-1H3a2 2 0 010-4h.09A1.65 1.65 0 004.6 9a1.65 1.65 0 00-.33-1.82l-.06-.06a2 2 0 012.83-2.83l.06.06A1.65 1.65 0 009 4.68a1.65 1.65 0 001-1.51V3a2 2 0 014 0v.09a1.65 1.65 0 001 1.51 1.65 1.65 0 001.82-.33l.06-.06a2 2 0 012.83 2.83l-.06.06A1.65 1.65 0 0019.4 9a1.65 1.65 0 001.51 1H21a2 2 0 010 4h-.09a1.65 1.65 0 00-1.51 1z"></path> </svg> Cost Reporting & PO Automation Module
    (Built by Satva)
6. <svg fill="none" stroke="currentColor" stroke-linecap="round" stroke-linejoin="round" stroke-width="2" viewbox="0 0 24 24"><polyline points="13 7 19 12 13 17"></polyline></svg>
7.  <svg aria-hidden="true" viewbox="0 0 48 48" xmlns="http://www.w3.org/2000/svg"> <defs> <radialgradient cx="36%" cy="32%" id="cs-qb-workflow-grad" r="68%"> <stop offset="0%" stop-color="#5fe03a"></stop> <stop offset="55%" stop-color="#2ca01c"></stop> <stop offset="100%" stop-color="#238718"></stop> </radialgradient> </defs> <circle cx="24" cy="24" fill="url(#cs-qb-workflow-grad)" r="24"></circle> <svg height="48" viewbox="0 0 2500 2500" width="48" x="0" y="0"> <path d="m301.3 1249.6c.1 282.6 228 512.4 510.6 514.9h72.3v-188.9h-72.3c-175.2 47.8-355.9-55.5-403.6-230.7-.4-1.4-.7-2.8-1.1-4.2-49.1-177.5 53.7-361.4 230.6-412.5h36.1c45.3-9.9 92.2-9.9 137.5 0h175.6v1002.9c-.9 106.1 84.4 192.9 190.5 193.9v-1395.4h-364.5c-284.6 1.5-514 233.4-512.5 518v.1zm1387.5-519.8h-72.3v198.9h72.3c174.8-47.7 355.1 55.3 402.8 230 .4 1.3.7 2.7 1.1 4 48.8 176.9-53.7 360.1-229.9 411.1h-36.1c-45.3 9.9-92.2 9.9-137.5 0h-175.6v-1002.8c.9-106.1-84.4-192.9-190.5-193.9v1397.4h364.5c287.1-4.5 516.2-240.8 511.8-527.9-4.4-280.8-230.9-507.4-511.8-511.8z" fill="#ffffff"></path> </svg>
     </svg> QuickBooks Online API
8. <svg fill="none" stroke="currentColor" stroke-linecap="round" stroke-linejoin="round" stroke-width="2" viewbox="0 0 24 24"><polyline points="13 7 19 12 13 17"></polyline></svg>
9.  <svg aria-hidden="true" fill="none" viewbox="0 0 24 24" xmlns="http://www.w3.org/2000/svg"> <rect fill="currentColor" height="8" rx="1" width="4" x="4" y="13"></rect> <rect fill="currentColor" height="12" rx="1" width="4" x="10" y="9"></rect> <rect fill="currentColor" height="16" rx="1" width="4" x="16" y="5"></rect> <path d="M3 15.5L9 11.5L15 8.5L21 5.5" stroke="currentColor" stroke-linecap="round" stroke-linejoin="round" stroke-width="2"></path> </svg> Reporting Engine
10. <svg fill="none" stroke="currentColor" stroke-linecap="round" stroke-linejoin="round" stroke-width="2" viewbox="0 0 24 24"><polyline points="13 7 19 12 13 17"></polyline></svg>
11.  <svg aria-hidden="true" fill="none" viewbox="0 0 40 40" xmlns="http://www.w3.org/2000/svg"> <circle cx="20" cy="20" fill="#B8A9E8" r="20"></circle> <rect fill="#fff" height="13" rx="1.5" width="18" x="11" y="14"></rect> <path d="M11 15.5l9 6.5 9-6.5" fill="none" stroke="#B8A9E8" stroke-linejoin="round" stroke-width="1.5"></path> </svg> PDF / XLSX / Email Output

System workflow from user to PDF, XLSX, and email output<svg fill="none" height="26" stroke="white" stroke-width="2" viewbox="0 0 24 24" width="26"><path d="M12 22s8-4 8-10V5l-8-3-8 3v7c0 6 8 10 8 10z"></path><polyline points="9 12 11 14 15 10"></polyline></svg>

## Key Features Delivered

- <svg fill="none" viewbox="0 0 12 12"><path d="M2 6l2.5 2.5L10 3" stroke="#fff" stroke-linecap="round" stroke-linejoin="round" stroke-width="1.8"></path></svg>QuickBooks Online OAuth connection
- <svg fill="none" viewbox="0 0 12 12"><path d="M2 6l2.5 2.5L10 3" stroke="#fff" stroke-linecap="round" stroke-linejoin="round" stroke-width="1.8"></path></svg>Auto-create missing vendors
- <svg fill="none" viewbox="0 0 12 12"><path d="M2 6l2.5 2.5L10 3" stroke="#fff" stroke-linecap="round" stroke-linejoin="round" stroke-width="1.8"></path></svg>Chart of Accounts sync
- <svg fill="none" viewbox="0 0 12 12"><path d="M2 6l2.5 2.5L10 3" stroke="#fff" stroke-linecap="round" stroke-linejoin="round" stroke-width="1.8"></path></svg>Auto-create missing accounts
- <svg fill="none" viewbox="0 0 12 12"><path d="M2 6l2.5 2.5L10 3" stroke="#fff" stroke-linecap="round" stroke-linejoin="round" stroke-width="1.8"></path></svg>Vendor sync
- <svg fill="none" viewbox="0 0 12 12"><path d="M2 6l2.5 2.5L10 3" stroke="#fff" stroke-linecap="round" stroke-linejoin="round" stroke-width="1.8"></path></svg>PDF export
- <svg fill="none" viewbox="0 0 12 12"><path d="M2 6l2.5 2.5L10 3" stroke="#fff" stroke-linecap="round" stroke-linejoin="round" stroke-width="1.8"></path></svg>Project-wise budget setup
- <svg fill="none" viewbox="0 0 12 12"><path d="M2 6l2.5 2.5L10 3" stroke="#fff" stroke-linecap="round" stroke-linejoin="round" stroke-width="1.8"></path></svg>XLSX export
- <svg fill="none" viewbox="0 0 12 12"><path d="M2 6l2.5 2.5L10 3" stroke="#fff" stroke-linecap="round" stroke-linejoin="round" stroke-width="1.8"></path></svg>8-column cost report
- <svg fill="none" viewbox="0 0 12 12"><path d="M2 6l2.5 2.5L10 3" stroke="#fff" stroke-linecap="round" stroke-linejoin="round" stroke-width="1.8"></path></svg>Email report sharing
- <svg fill="none" viewbox="0 0 12 12"><path d="M2 6l2.5 2.5L10 3" stroke="#fff" stroke-linecap="round" stroke-linejoin="round" stroke-width="1.8"></path></svg>Editable forecast fields
- <svg fill="none" viewbox="0 0 12 12"><path d="M2 6l2.5 2.5L10 3" stroke="#fff" stroke-linecap="round" stroke-linejoin="round" stroke-width="1.8"></path></svg>Custom reporting periods
- <svg fill="none" viewbox="0 0 12 12"><path d="M2 6l2.5 2.5L10 3" stroke="#fff" stroke-linecap="round" stroke-linejoin="round" stroke-width="1.8"></path></svg>Purchase order automation
- <svg fill="none" viewbox="0 0 12 12"><path d="M2 6l2.5 2.5L10 3" stroke="#fff" stroke-linecap="round" stroke-linejoin="round" stroke-width="1.8"></path></svg>Admin configuration & controls

<svg fill="none" height="26" stroke="white" stroke-width="2" viewbox="0 0 24 24" width="26"></svg>

## Results & Impact

| Area | Before | After | Impact |
|---|---|---|---|
| Cost Report Generation | 3 Hours | 15 Minutes | Automated QuickBooks sync and purchase order aggregation eliminated manual exports and spreadsheet preparation. |
| Manual Reconciliation | High manual effort | 75% reduction | Actual expenses, commitments, budgets, and variance now merge into a single automated 8-column cost report. |
| Forecast Accuracy | Limited & reactive | 45% improvement | Editable Estimated Final Cost and automated Estimate to Complete enable proactive cost adjustments before overruns occur. |
| PO Creation Failures | Errors from missing QuickBooks records | 100% elimination | Automated vendor and account creation removed purchase order errors caused by missing QuickBooks records. |
| Stakeholder Reporting | Manual exports & distribution | 50% faster | Instant PDF/XLSX exports with structured formatting and direct email distribution streamlined financial communication. |
| Multi-Project Financial Visibility | Scattered data & rising overhead | Scalable, real-time on demand | Real-time spend, commitments, forecasts, and variance are accessible on demand without increasing operational overhead. |

<svg fill="none" height="26" stroke="white" stroke-width="2" viewbox="0 0 24 24" width="26"><rect height="14" rx="2" width="20" x="2" y="3"></rect></svg>

## Technology Stack

-  <svg fill="none" height="36" viewbox="0 0 24 24" width="36" xmlns="http://www.w3.org/2000/svg"> <circle cx="12" cy="12" fill="currentColor" r="2.2"></circle> <ellipse cx="12" cy="12" rx="10" ry="3.8" stroke="currentColor" stroke-width="1.4"></ellipse> <ellipse cx="12" cy="12" rx="10" ry="3.8" stroke="currentColor" stroke-width="1.4" transform="rotate(60 12 12)"></ellipse> <ellipse cx="12" cy="12" rx="10" ry="3.8" stroke="currentColor" stroke-width="1.4" transform="rotate(120 12 12)"></ellipse> </svg> Frontend:

    React

    -  <svg fill="none" height="36" viewbox="0 0 24 24" width="36" xmlns="http://www.w3.org/2000/svg"> <circle cx="12" cy="12" fill="#2ca01c" r="11"></circle> <text fill="#fff" font-family="IBM Plex Sans,sans-serif" font-size="9" font-weight="700" text-anchor="middle" x="12" y="15.5">qb</text> </svg> Integration:

    QuickBooks Online OAuth 2.0 & API

    -  <svg fill="none" height="36" viewbox="0 0 24 24" width="36" xmlns="http://www.w3.org/2000/svg"> <circle cx="12" cy="12" fill="currentColor" r="11"></circle> <text fill="#fff" font-family="IBM Plex Sans,sans-serif" font-size="6.5" font-weight="700" text-anchor="middle" x="12" y="14.5">.NET</text> </svg> Backend:

    .NET (RESTful API Architecture)

    -  <svg fill="none" height="36" stroke="currentColor" stroke-width="1.6" viewbox="0 0 24 24" width="36"> <path d="M14 2H6a2 2 0 00-2 2v16a2 2 0 002 2h12a2 2 0 002-2V8z"></path> <polyline points="14 2 14 8 20 8"></polyline>   </svg> Reporting:

    PDF & XLSX Generation

    -  <svg fill="none" height="36" stroke="currentColor" stroke-width="1.6" viewbox="0 0 24 24" width="36"> <ellipse cx="12" cy="5.5" rx="8" ry="3"></ellipse> <path d="M4 5.5v13c0 1.66 3.58 3 8 3s8-1.34 8-3v-13"></path> <path d="M4 12c0 1.66 3.58 3 8 3s8-1.34 8-3"></path> </svg> Database:

    SQL Server

    -  <svg fill="none" height="36" stroke="currentColor" stroke-width="1.6" viewbox="0 0 24 24" width="36"> <path d="M18 10h-1.26A8 8 0 109 20h9a5 5 0 000-10z"></path> </svg> Deployment:

    Cloud Environment


<svg fill="none" height="26" stroke="white" stroke-linecap="round" stroke-linejoin="round" stroke-width="2" viewbox="0 0 24 24" width="26"><path d="M21 15a2 2 0 01-2 2H7l-4 4V5a2 2 0 012-2h14a2 2 0 012 2z"></path><polyline points="9 11 11 13 15 9"></polyline></svg>

## Client Testimonial

“Satva Solutions has completely transformed the way we manage project finances. The automated reporting and PO workflow have saved us countless hours and improved accuracy across the board.

<svg fill="none" height="26" stroke="white" stroke-linecap="round" stroke-linejoin="round" stroke-width="2" viewbox="0 0 24 24" width="26"><circle cx="12" cy="12" r="9"></circle><polyline points="9 12 11 14 15 10"></polyline></svg>

## Conclusion

Satva Solutions transformed Conduiit from a project workflow platform into a real-time financial control system, enabling finance teams to move beyond manual reconciliation and adopt proactive cost management.

The result is a unified platform where operational execution and financial intelligence work seamlessly together, empowering businesses with faster decision-making, stronger budget control, improved visibility, sustainable scalability, less reconciliation, and better overall financial control.

By tightly integrating operational workflows with QuickBooks accounting data, the solution delivered:

- <svg fill="none" stroke="currentColor" stroke-linecap="round" stroke-linejoin="round" stroke-width="1.8" viewbox="0 0 24 24"><path d="M1 12s4-8 11-8 11 8 11 8-4 8-11 8-11-8-11-8z"></path><circle cx="12" cy="12" r="3"></circle></svg>Complete
    Visibility
- <svg fill="none" stroke="currentColor" stroke-linecap="round" stroke-linejoin="round" stroke-width="1.8" viewbox="0 0 24 24"><polyline points="23 6 13.5 15.5 8.5 10.5 1 18"></polyline><polyline points="17 6 23 6 23 12"></polyline></svg>Dynamic
    Forecasting
- <svg fill="none" stroke="currentColor" stroke-linecap="round" stroke-linejoin="round" stroke-width="1.8" viewbox="0 0 24 24"><path d="M22 11.08V12a10 10 0 11-5.93-9.14"></path><polyline points="22 4 12 14.01 9 11.01"></polyline></svg>Error-Free
    Automation
- <svg fill="none" stroke="currentColor" stroke-linecap="round" stroke-linejoin="round" stroke-width="1.8" viewbox="0 0 24 24"><path d="M14 2H6a2 2 0 00-2 2v16a2 2 0 002 2h12a2 2 0 002-2V8z"></path><polyline points="14 2 14 8 20 8"></polyline></svg>Standardized
    Reporting
- <svg fill="none" stroke="currentColor" stroke-linecap="round" stroke-linejoin="round" stroke-width="1.8" viewbox="0 0 24 24"><rect height="7" width="7" x="3" y="3"></rect><rect height="7" width="7" x="14" y="3"></rect><rect height="7" width="7" x="3" y="14"></rect><rect height="7" width="7" x="14" y="14"></rect></svg>Scalable for
    Multiple Projects

<svg fill="none" height="26" stroke="white" stroke-linecap="round" stroke-linejoin="round" stroke-width="2" viewbox="0 0 24 24" width="26"><path d="M12 22s8-4 8-10V5l-8-3-8 3v7c0 6 8 10 8 10z"></path></svg>

## Why Satva Solutions

Satva combines deep accounting workflow knowledge with strong engineering expertise. Our experience with QuickBooks integrations, custom reporting, and automation helped Conduiit transform its financial process into a reliable, accurate, and scalable system.

- <svg fill="none" stroke="currentColor" stroke-linecap="round" stroke-linejoin="round" stroke-width="1.8" viewbox="0 0 24 24"><path d="M17 21v-2a4 4 0 00-4-4H5a4 4 0 00-4 4v2"></path><circle cx="9" cy="7" r="4"></circle><path d="M23 21v-2a4 4 0 00-3-3.87"></path><path d="M16 3.13a4 4 0 010 7.75"></path></svg>Accounting & Finance
    Domain Expertise
-  <svg aria-hidden="true" viewbox="0 0 48 48" xmlns="http://www.w3.org/2000/svg"> <defs> <radialgradient cx="36%" cy="32%" id="cs-qb-why-grad" r="68%"> <stop offset="0%" stop-color="#5fe03a"></stop> <stop offset="55%" stop-color="#2ca01c"></stop> <stop offset="100%" stop-color="#238718"></stop> </radialgradient> </defs> <circle cx="24" cy="24" fill="url(#cs-qb-why-grad)" r="24"></circle> <svg height="48" viewbox="0 0 2500 2500" width="48" x="0" y="0"> <path d="m301.3 1249.6c.1 282.6 228 512.4 510.6 514.9h72.3v-188.9h-72.3c-175.2 47.8-355.9-55.5-403.6-230.7-.4-1.4-.7-2.8-1.1-4.2-49.1-177.5 53.7-361.4 230.6-412.5h36.1c45.3-9.9 92.2-9.9 137.5 0h175.6v1002.9c-.9 106.1 84.4 192.9 190.5 193.9v-1395.4h-364.5c-284.6 1.5-514 233.4-512.5 518v.1zm1387.5-519.8h-72.3v198.9h72.3c174.8-47.7 355.1 55.3 402.8 230 .4 1.3.7 2.7 1.1 4 48.8 176.9-53.7 360.1-229.9 411.1h-36.1c-45.3 9.9-92.2 9.9-137.5 0h-175.6v-1002.8c.9-106.1-84.4-192.9-190.5-193.9v1397.4h364.5c287.1-4.5 516.2-240.8 511.8-527.9-4.4-280.8-230.9-507.4-511.8-511.8z" fill="#ffffff"></path> </svg>
     </svg> QuickBooks
    Integration Specialists
- <svg fill="none" stroke="currentColor" stroke-linecap="round" stroke-linejoin="round" stroke-width="1.8" viewbox="0 0 24 24"><circle cx="12" cy="12" r="3"></circle><path d="M19.4 15a1.65 1.65 0 00.33 1.82l.06.06a2 2 0 01-2.83 2.83l-.06-.06a1.65 1.65 0 00-1.82-.33 1.65 1.65 0 00-1 1.51V21a2 2 0 01-4 0v-.09A1.65 1.65 0 009 19.4a1.65 1.65 0 00-1.82.33l-.06.06a2 2 0 01-2.83-2.83l.06-.06A1.65 1.65 0 004.68 15a1.65 1.65 0 00-1.51-1H3a2 2 0 010-4h.09A1.65 1.65 0 004.6 9a1.65 1.65 0 00-.33-1.82l-.06-.06a2 2 0 012.83-2.83l.06.06A1.65 1.65 0 009 4.68a1.65 1.65 0 001-1.51V3a2 2 0 014 0v.09a1.65 1.65 0 001 1.51 1.65 1.65 0 001.82-.33l.06-.06a2 2 0 012.83 2.83l-.06.06A1.65 1.65 0 0019.4 9a1.65 1.65 0 001.51 1H21a2 2 0 010 4h-.09a1.65 1.65 0 00-1.51 1z"></path></svg>Custom Reporting &
    Automation Experts
- <svg fill="none" stroke="currentColor" stroke-linecap="round" stroke-linejoin="round" stroke-width="1.8" viewbox="0 0 24 24"><path d="M12 22s8-4 8-10V5l-8-3-8 3v7c0 6 8 10 8 10z"></path><polyline points="9 12 11 14 15 10"></polyline></svg>Scalable & Secure
    Architecture
- <svg fill="none" stroke="currentColor" stroke-linecap="round" stroke-linejoin="round" stroke-width="1.8" viewbox="0 0 24 24"><path d="m11 17 2 2a1 1 0 1 0 3-3"></path><path d="m14 14 2.5 2.5a1 1 0 1 0 3-3l-3.88-3.88a3 3 0 0 0-4.24 0l-.88.88a1 1 0 1 1-3-3l2.81-2.81a5.79 5.79 0 0 1 7.06-.87l.47.28a2 2 0 0 0 1.42.25L21 4"></path><path d="m21 3 1 11h-2"></path><path d="M3 3 2 14l6.5 6.5a1 1 0 1 0 3-3"></path><path d="M3 4h8"></path></svg>Long-term Support &
    Partnership

<svg fill="none" height="26" stroke="white" stroke-linecap="round" stroke-linejoin="round" stroke-width="2" viewbox="0 0 24 24" width="26"><path d="M4.5 16.5c-1.5 1.26-2 5-2 5s3.74-.5 5-2c.71-.84.7-2.13-.09-2.91a2.18 2.18 0 00-2.91-.09z"></path><path d="M12 15l-3-3a22 22 0 012-3.95A12.88 12.88 0 0122 2c0 2.72-.78 7.5-6 11a22.35 22.35 0 01-4 2z"></path><path d="M9 12H4s.55-3.03 2-4c1.62-1.08 5 0 5 0"></path><path d="M12 15v5s3.03-.55 4-2c1.08-1.62 0-5 0-5"></path></svg>

## Next Steps

 <svg fill="none" viewbox="0 0 96 96" xmlns="http://www.w3.org/2000/svg"> <rect fill="#fff" height="54" rx="6" stroke="#d1dbe8" stroke-width="2" width="58" x="14" y="20"></rect> <rect fill="currentColor" height="14" rx="6" width="58" x="14" y="20"></rect> <rect fill="currentColor" height="6" width="58" x="14" y="28"></rect>      <circle cx="68" cy="68" fill="currentColor" r="16"></circle> <path d="M61 68l5 5 11-11" stroke="#fff" stroke-linecap="round" stroke-linejoin="round" stroke-width="3"></path> </svg> Looking to automate your financial reporting or integrate QuickBooks with your platform?

[<svg fill="none" height="18" stroke="currentColor" stroke-linecap="round" stroke-linejoin="round" stroke-width="2" viewbox="0 0 24 24" width="18"><rect height="18" rx="2" width="18" x="3" y="4"></rect></svg>Book a Free Consultation
 ](https://satvasolutions.com/contact)


---

_View the original post at: [https://satvasolutions.com/case-study/from-scattered-financial-data-to-real-time-cost-control-the-conduiit-cost-report-transformation-new](https://satvasolutions.com/case-study/from-scattered-financial-data-to-real-time-cost-control-the-conduiit-cost-report-transformation-new)_  
_Served as markdown by [Third Audience](https://github.com/third-audience) v3.5.4_  
_Generated: 2026-08-05 10:23:30 UTC_  
